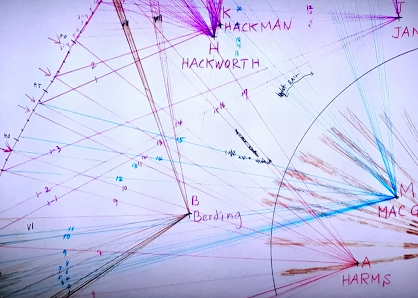
50th Anniversary of the Superoutbreak: The Story of a Map
 |
| Xenia, Ohio, F-5 Intensity Tornado, Wiki |
Today and Thursday are the 50th anniversary of one of the two most vicious tornado outbreaks in the history of the United States (the other was April 27, 2011). There were 148 tornadoes in less than 17 hours on April 3 and 4, 1974. Tragically, there were 319 fatalities and the damage (2024 dollars) was $5.3 billion. There were eight storms that reached the rare F-5 intensity, which was part of the reason the death toll was so high. The other reason was the sheer number of tornadoes and other severe weather messages overwhelmed the slow 55-word per minute communication systems. Some tornado warnings were not broadcast until after they had expired.
 |
| Xenia Tornado at upper left as viewed on Cincinnati radar |
I was a senior meteorology student at the University of Oklahoma and was in the “map room” that afternoon. We knew something “big” was in progress but it was impossible to get a handle on it because viewing distant radars, practical and pertinent weather satellite images, and adequate communications had not yet been invented. For example, other than at the NWS office where the radar was located, no one else could directly view the Cincinnati radar (above) -- or any other.The story of the outbreak and how it revolutionized weather science is told in my book, Warnings: The True Story of How Science Tamed the Weather.
Undoubtedly, other meteorologists this week are going to tell the important stories of Xenia and the other cities and towns and their people that suffered so terribly from these tornadoes.
I want to take a different angle.
This the story of a map. It is the story of one of the most extraordinary maps in the history of science. Boring, you might say? Stay tuned!!
In the mid-1970’s, Dr. Ted Fujita of the University of Chicago was at the peak of his research capabilities. He had already hypothesized “suction vorticies” (mini-tornadoes swirling around the main tornado with even stronger, more concentrated winds) and had developed the “Fujita Scale” that rated tornadoes by the intensity of the damage they caused. His study of the 1957 Fargo Tornado was considered the finest study of its type – ever. Ted had a unique forensic approach to weather research that was key to his many discoveries. Unlike so many meteorological researchers who stay in the lab, Ted was always out in the middle of whatever he wanted to study.
Before the final tornado lifted April 4th, Fujita was marshaling a “dream team” of his graduate students and former students to take on the herculean task of learning what they could from this unprecedented event. This included chartering a small air force of Cessna high wing aircraft (great for photography) that could fly low and (relatively) slow so the path of the tornadoes could be thoroughly documented.
 |
| Ted and John McCarthy, PBS |
When we came to class on the 5th, Friday morning, Dr. John McCarthy, our atmospheric physics professor, said he would be gone at least a week as he was joining Dr. Fujita’s survey team. Ted, John, Roger Wakimoto, Greg Forbes and others assembled a mountain of data.
 |
| PBS |
Ted himself flew 10,000 miles surveying 2,598 miles of the paths of what he determined were 148 tornadoes.
- Enlarging the NOAA Weather Radio system,
- Emergency power at all NWS offices,
- A new system for interstate tornado warnings,
- More TV stations hooking directly into the NWS weather wire, rather than waiting for Associated Press or other sources,
- As we have discussed on previous occasions, in 1974, there was an unwritten rule to not mention tornadoes in forecasts until the day of the event. The NWS recommended that change (below),


Mike, nice article o Ted’s work on the Superoutbreak. I know being a student of his, being meticulous and accurate were drilled into my head by him. Only by doing detailed work like he and his students did, can yo come up with an accurate assessment of what happened.- Brian Smith
ReplyDeleteBrian, thanks so much for your comment. Very best wishes. /s/ Mike
Delete